The largest tree alive has a fence around it, and the fence is not for the bark
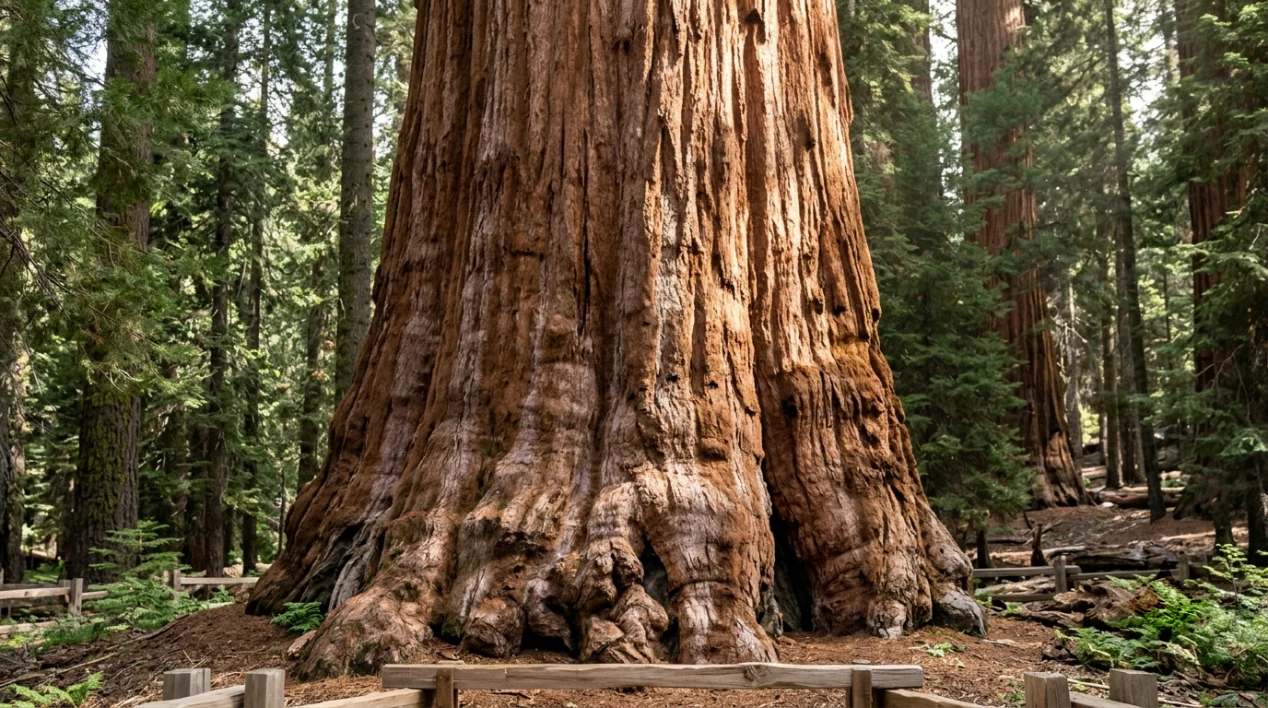
Take a cube of solid wood 11.4 metres on each side. That is roughly the amount of wood in the trunk of the General Sherman tree, and the figure is not a guess: the standard citation gives a bole volume of 1,487 cubic metres (52,513 cubic feet), with a height of 83.8 metres (275 feet) and a trunk 7.7 metres (25 feet) across.
The estimate for its age runs from 2,300 to 2,700 years, which puts its seed somewhere in the period when the Roman Republic still existed. Taken together, those numbers explain why this tree is described as being among the tallest, widest, and longest-lived trees on the planet at the same time.
It stands in the Giant Forest in Sequoia National Park in California, on a paved walkway, behind a perimeter fence.
The name is the easy part to tell badly. The tree is named after William Tecumseh Sherman, the Civil War general, and the account most often repeated is that a naturalist called James Wolverton named it in 1879. Reference works flag that story as possibly apocryphal, which is the honest way to say it: the name stuck, and the man who chose it may or may not have been the man you will read about in a gift-shop brochure.
So why the fence? Bark is thick enough here that a person cannot damage the tree by leaning on it, and the trunk is far too wide to cut through with anything a visitor would carry. The answer is boring, and it explains more about how a park works than about how a tree works.
It also turns out the largest branch on this tree is gone. It broke off in January 2006.
The largest tree alive has a fence around it, and the fence is not for the bark

If you look at photographs of the General Sherman tree taken before 2006, one feature is impossible to miss: a branch about a quarter of the way down the trunk that stuck out and then turned up, forming a shape people compared to an L or a golf club. That branch broke off in January 2006.
A branch that size is a mature tree by any ordinary measure. Its loss did not kill the trunk, and the tree is still standing at the same height. What it shows is where the real danger sits. At this scale, the failure mode is not a person with a saw. It is weight, water, wind, and the accumulated years it takes to build two thousand years of wood.
The fence is about a different risk, and it is the one a park can actually manage.
A trail that a hundred thousand pairs of feet compress into bare, compacted ground sheds rain instead of soaking it up, and the roots of a shallow-rooted tree are the first thing to suffer for it. A park that wants the tree to keep growing puts something between those boots and that soil. The walkway around the base is paved for the same reason, and the perimeter fence gets damaged by traffic rather than by vandals: on one occasion a vehicle smashed part of that fence and cratered the pavement of the surrounding walkway.
The sequoia's own defences are worth one paragraph, because they are part of why any of this survives. Giant sequoia bark is thick and contains very little resin, so a fire that would kill a thinner-barked neighbour often leaves a sequoia scorched on the outside and intact underneath. Fire also clears the ground the species needs for new trees, which is why a park that suppresses every fire eventually ends up with a grove of adults and no children.
What is left is a tree that has outlived most of the things around it and now has an engineered relationship with its visitors: pavement, a fence, a loop road, and a branch missing since 2006.
The practical part is next, and there is one number you should look up before you drive anywhere.
The largest tree alive has a fence around it, and the fence is not for the bark
Before you go, check three things on the park's own pages, because all three change: the vehicle entry fee, whether the road to the Giant Forest is open, and whether the park currently requires a reservation for a particular date. Anything written here about prices would be out of date within a season, so I am not going to invent a number.
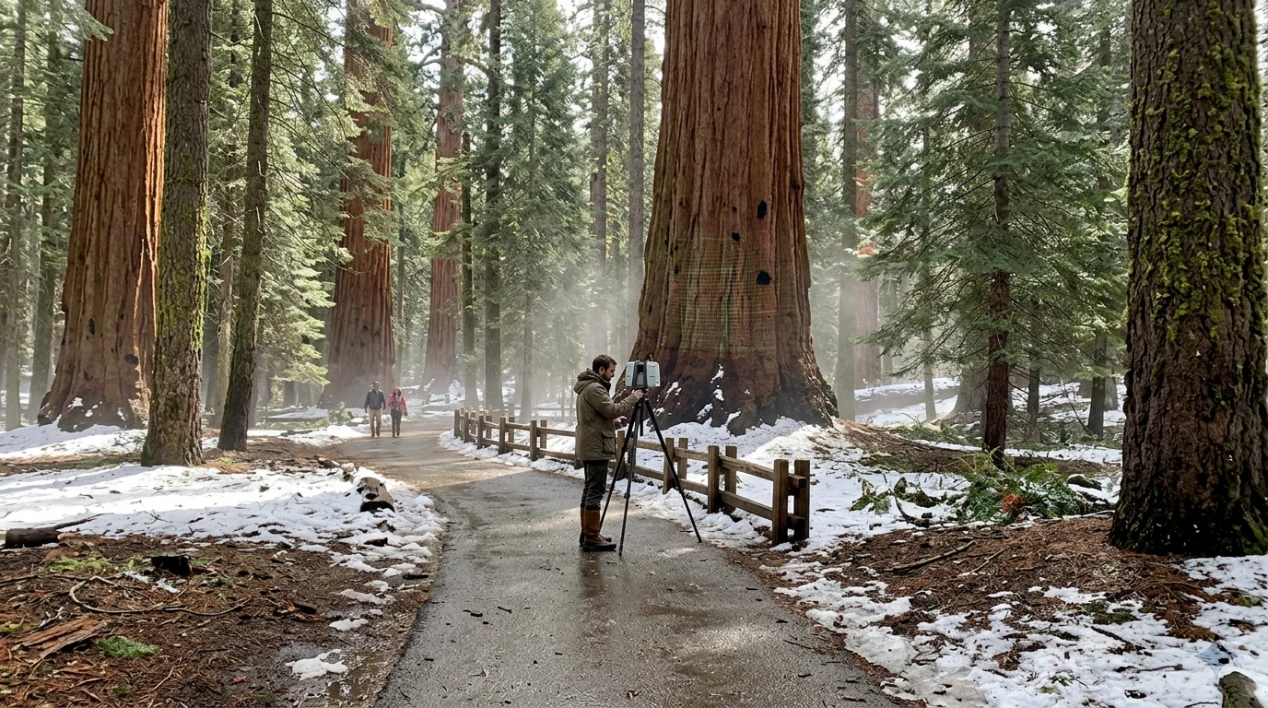
The walk from the parking area to the base is short and paved. People do it in sneakers. There is no technical difficulty, and the main reason visitors fail to reach it is that they arrive in the wrong part of the year and find the road closed.
Two things make the visit worth more than a photograph.
The first is scale, and you can only get it next to the trunk. Volume figures do not communicate standing next to something 7.7 metres across, and the reason people come back with the same six photos from the same spot is that there is no vantage point from which the tree reads as big. It reads as a wall.
The second is that the Giant Forest is a grove, not a monument. The trees around it are also ancient, also huge, and mostly unphotographed, and the reason the Sherman tree is the one with a fence is partly that someone measured it and put a number in a document. That 1,487 cubic metre figure is a 1997 measurement that is still the citation. Work on big trees now tends to use lasers rather than tape, so if the number is revised in your lifetime, the figure on this page is the one that was current when the article was written.
For a comparison you can hold on to: coast redwoods grow taller than giant sequoias. The Sherman tree wins on the volume of a single trunk, which is the number that matters if you are interested in how much living thing can stand in one place.
That, plus the missing branch, plus the fence. Roughly 1,487 cubic metres of wood, still adding to it.
Sources and notes
- General Sherman: height, trunk diameter, bole volume, age estimate, the January 2006 branch loss, the perimeter fence and walkway damage, and the 1879 naming account. English Wikipedia, consulted 12 November 2026.
- Entry fee, road closures and reservations: current pages of the US National Park Service.
- Bark thickness and fire ecology of giant sequoia: National Park Service sequoia ecology pages.
A 2,000 dollar graphics card comes with three bills
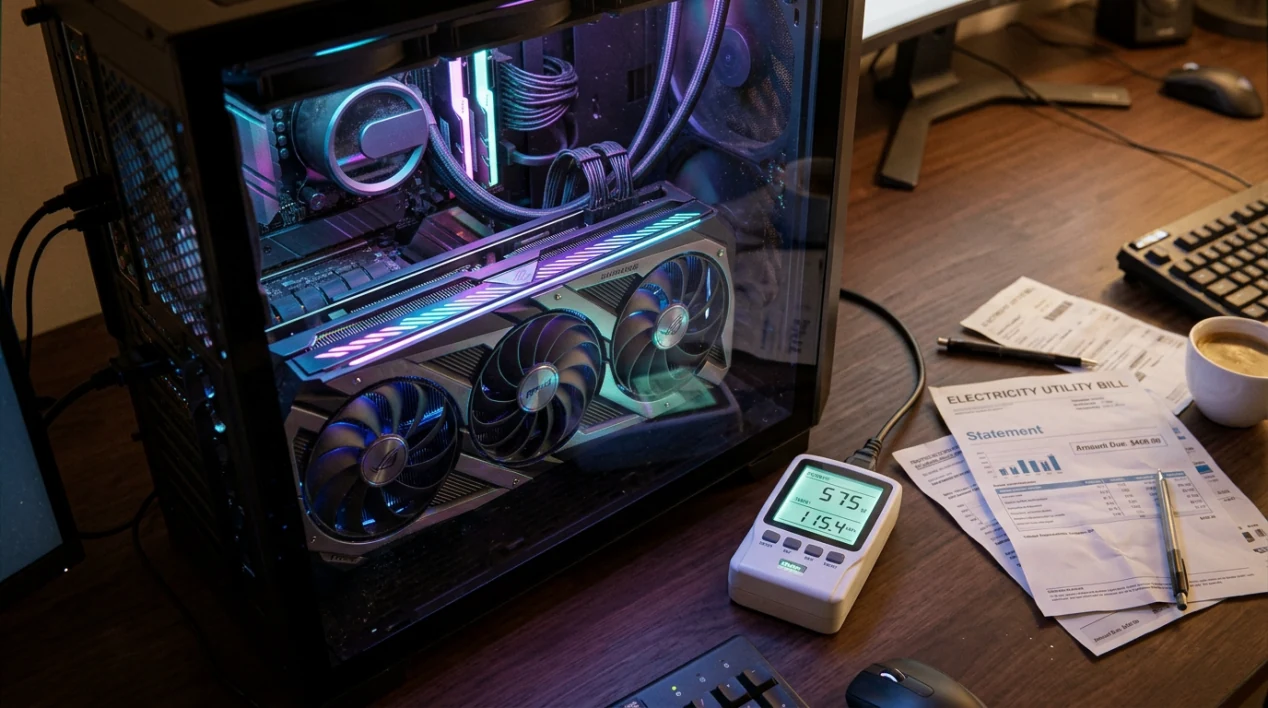
The sticker price is the smallest of the three. One of the other two lands on your own electricity statement, and the third never reaches a bill you will ever see.
Everything below is arithmetic you can redo with your own numbers, so I will use a worked example and label it as an example rather than a measurement.
Assume a card with a board power of 600 watts, run hard 20 hours a week. That is 1,040 hours a year, so 624 kWh. Multiply by whatever your bill charges per kilowatt-hour: at 0.10 the year costs 62, at 0.30 it costs 187, at 0.45 it costs 281, in your own currency. Same card, same usage, and a factor of four between the cheapest and the most expensive case, which is why an identical computer is a different purchase in Berlin, Texas and Sydney. Substitute the figure printed on your bill; the example is the method, not the answer.
Three things push that number up from the version above.
The power supply. The watts that reach the silicon are fewer than the watts drawn from the wall. If a supply converts at 90 percent at typical load, 600 watts of card means roughly 667 watts at the socket, and the difference is heat you paid for and then have to get rid of. A supply that is undersized for the machine spends more of the year in the inefficient part of its curve, which is a permanent tax on every hour the box is on.
The idle hours. A machine left on for a local model, a render queue, or a second monitor spends far more of its year in a low-draw state than in the peak state printed on the box. Those hours are individually small and collectively most of your bill, because there are so many of them.
The rest of the system. Processor, drives and fans add their own draw on top of the card, and a workload that saturates all of them at once is worth pricing as a whole machine rather than as a component.
Write your own version of the two lines below before you decide anything.
Annual kWh = card watts × your heavy-use hours per year ÷ 1000
Annual cost = Annual kWh × the price per kWh on your bill
Now take the second bill, the one people are always surprised by because in January it is not a cost at all.
A 2,000 dollar graphics card comes with three bills
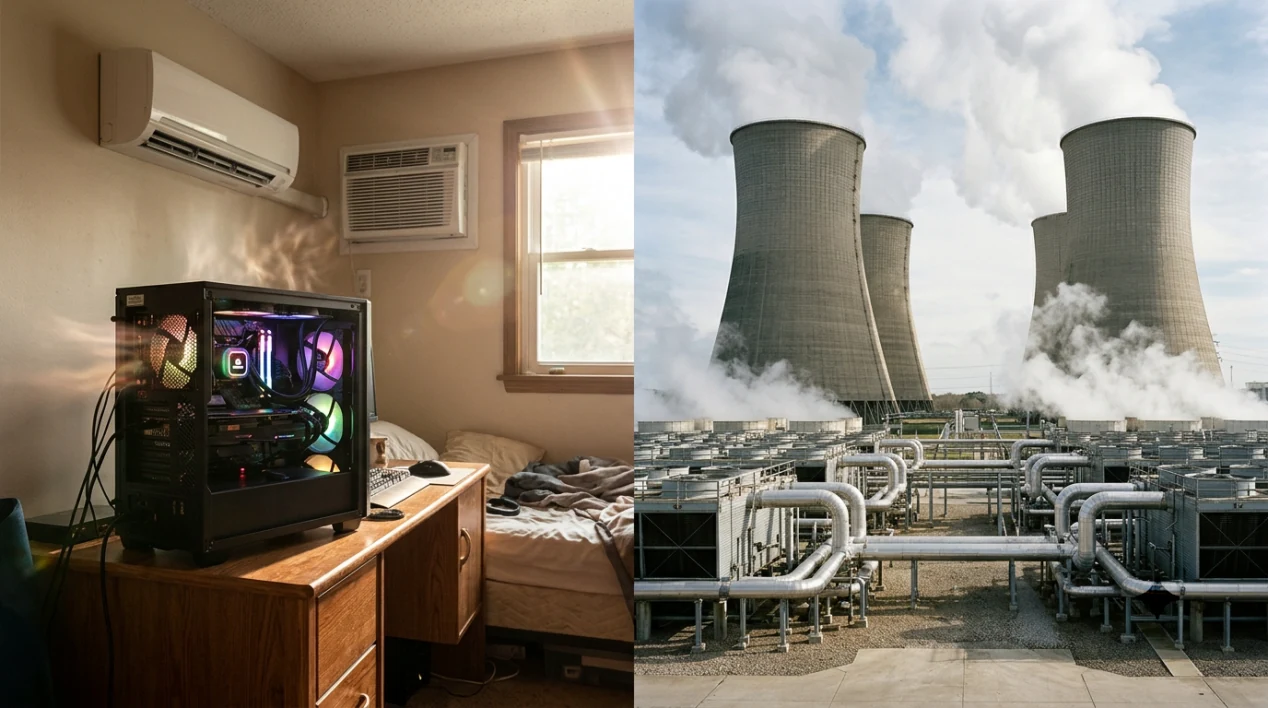
A loaded graphics card converts nearly all of the electricity it draws into heat inside your room. The two numbers are the same number. A card taking 600 watts is a 600 watt heater, and 600 watts is about 2,050 British thermal units per hour, which is the figure an air-conditioning salesperson would quote at you.
What that means in practice depends almost entirely on which season you are in.
In winter, in a cold climate, the heat is doing double duty. You would have run a heater anyway, and the machine is one. This is the only case where the second bill is genuinely free, and it is why some people run compute work in an unheated spare room and enjoy it.
In summer it is a real cost. A room that has to stay habitable needs the heat removed, and removing heat takes energy. Run the arithmetic: an air conditioner that moves 600 watts of heat out of a room, with a coefficient of performance around 3, spends roughly 200 watts of electricity doing it. So a hot afternoon of heavy work costs you the card's 600 watts plus about a third of that again, every hour. In a climate with a long cooling season, that addition is a sizeable fraction of your annual electricity, and it is invisible on the retailer's page for the card.
Between those two cases sits the one that actually shortens the machine's life. Sustained high temperatures make fans run louder and longer, and heat is how capacitors and solder joints age. A card bought for quiet overnight work becomes a card you stop leaving on, and that is a purchase you have already paid for twice.
There is a version of all this at building scale, and it is where the third bill comes from.
A room full of these cards has the same physics with no option to open a window. Cooling can mean chillers, evaporative systems, or towers that give water off to the air deliberately. Which one an operator chooses depends on local power price, local water price and how dry the air is, and in a dry place the cheapest option on electricity is often the most expensive on water.
The last bill is not in your house at all, and it is the reason a new fabrication plant is argued about in public for years.
A 2,000 dollar graphics card comes with three bills
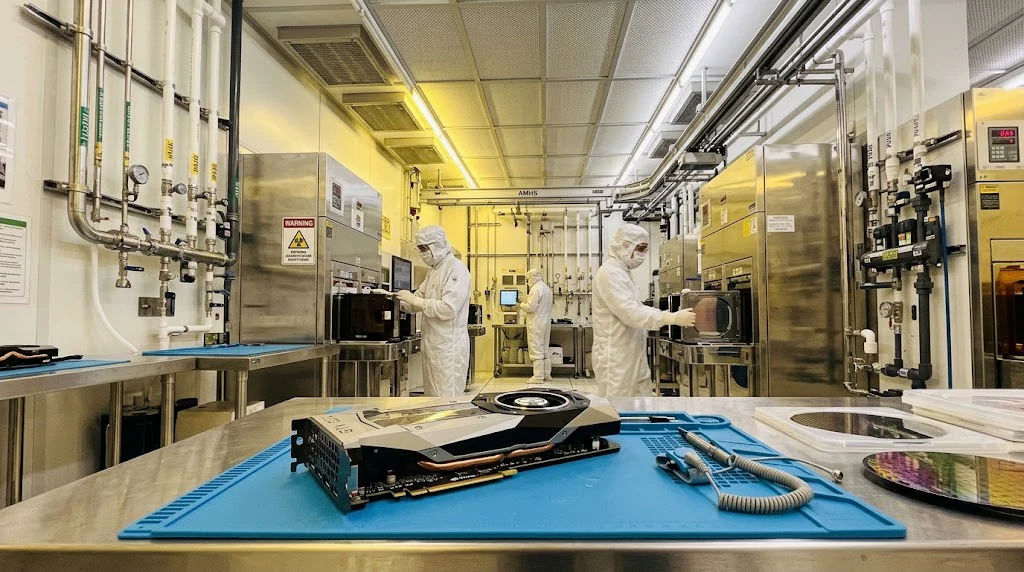
Silicon is fabricated with very large volumes of ultrapure water, because anything dissolved in the water ends up on the surface of the chip. That is a general fact about the process, and it is why the siting of a new fab becomes a fight over water rights in whatever region gets one. I am deliberately not quoting a litres-per-wafer figure here, because the numbers that circulate differ wildly depending on whether they count a single fab, a campus, a city's total demand, or how much of the water is reclaimed and reused. If you want the real figure, look up the water disclosure of a specific named plant for a specific year and read what it counts.
So the three bills are your electricity, the heat you then pay to move, and the water someone else spends to make the thing. Only the first arrives as a meter reading, which is why the other two get argued about as morality instead of arithmetic.
What to do with all of it, in five lines.
Price the machine as a whole, including the power supply, before you commit to the card. Choose a supply with some headroom and a good efficiency curve at your typical load, because conversion losses follow you every hour. If you are in a hot climate, put the cooling cost into the decision now rather than in the first heatwave, because that is when the number appears on a bill you cannot renegotiate. Decide what the machine will be doing in the first month and how many hours a week, and if you cannot answer, the real cost of that purchase is the full price plus a warm box. And treat the water bill as what it is, a fact about where the card came from, with nothing for you to optimise at home.
Two of the three bills are yours. The third belongs to whoever chose the site of the fab, and the only honest thing a review can say about it is that making a computer is heavier on water than most buyers assume.
For reference, my example came to 624 kWh a year. Put your own two numbers into the same two lines and you have something better than a spec sheet: a cost that is actually yours.
Sources and notes
- Every figure on this page is arithmetic from stated inputs: 600 W at 20 h per week is 624 kWh per year; 2,050 BTU per hour is 600 W multiplied by 3.412; a coefficient of performance of 3 turns 600 W of heat into about 200 W of electricity.
- Card board power, power-supply efficiency and unit electricity prices are reader inputs. Nothing here is a claim about a specific product or a specific country's tariff.
- Ultrapure water in semiconductor fabrication is standard process knowledge. No water-consumption figure is quoted, and the page explains why.
Eleven years in prison for what a blood-test company said it could do
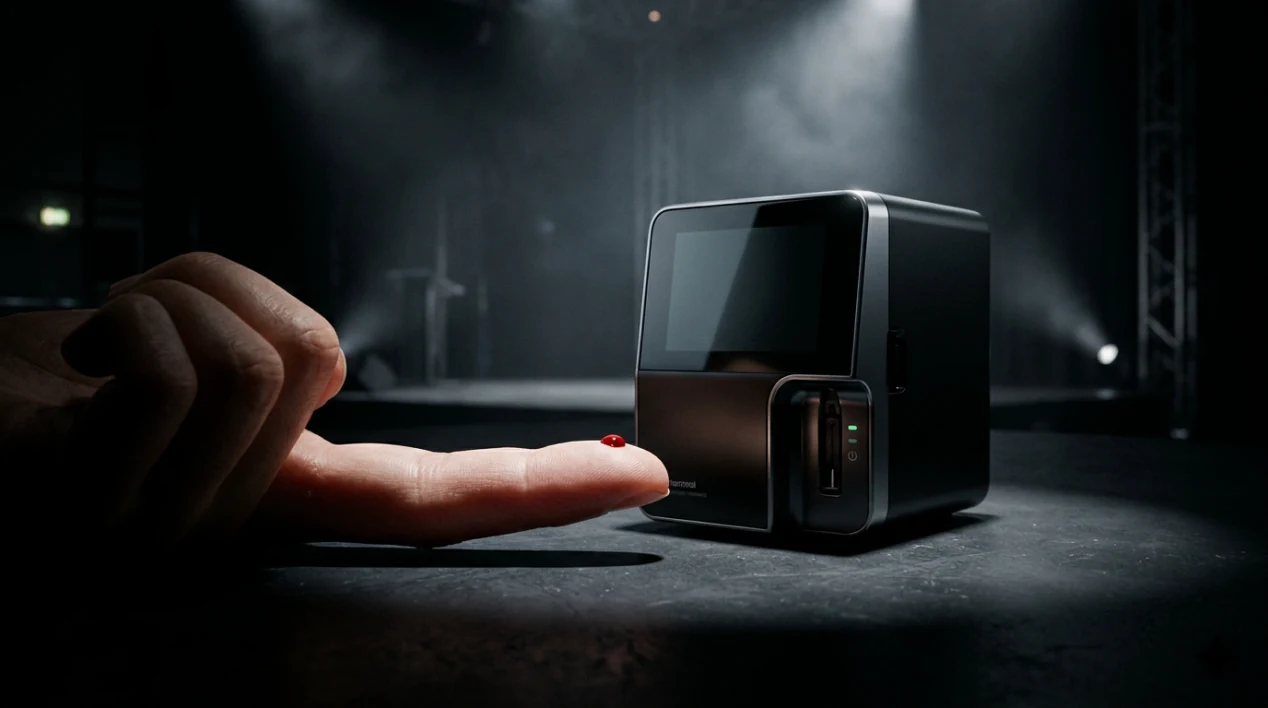
The pitch fits in one sentence. A blood test should be as easy as a pregnancy test, and a company was going to make it so: a few drops pinched out of a fingertip instead of a needle in the arm, with results in hours.
Theranos said that sentence for years, in investor meetings, on magazine covers, and in partnerships with drugstore chains that wanted finger-prick testing in their shops. On 3 January 2022 a court found its founder guilty of fraud. On 18 November that year she was sentenced to eleven years and three months in prison, ordered to pay 452 million dollars in restitution, and sent to the Federal Prison Camp in Bryan, Texas.
Those are the four numbers in this story. Everything else is about how a claim stays standing long enough to become one.
Trial coverage spent a lot of time on the presentation, and I want to keep that in proportion. The reports described a founder who appeared on stage in a black turtleneck, with a deliberately low voice, answering technical questions with statements about the future instead of about the assay. Some of that was style. The part that mattered is that the questions were answerable and were not being answered.
Which is the useful observation for a reader who will never start a company: a promise about a physical process can be checked in a specific way, and there is a specific reason a seller avoids that check.
The next section is about the person who did the check, because in this case it was a journalist rather than a regulator, and the difference says something about how these companies get their time.
Eleven years in prison for what a blood-test company said it could do
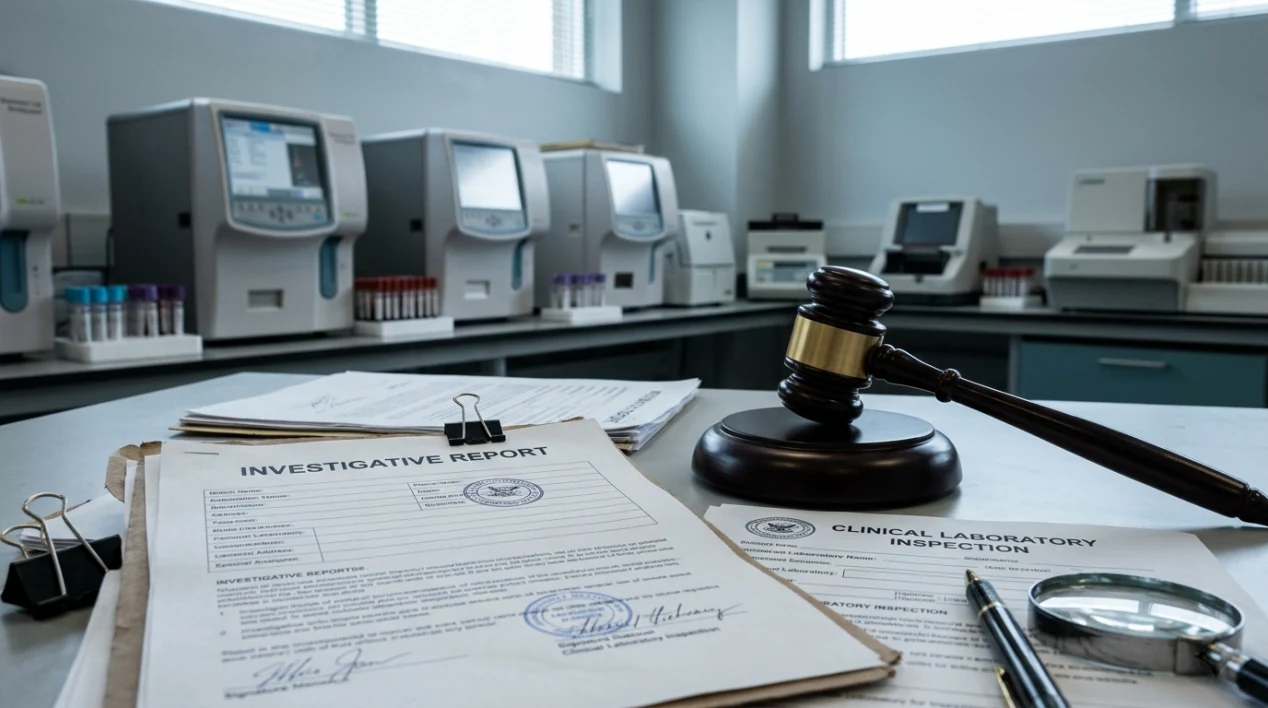
In 2015 John Carreyrou, then reporting for the Wall Street Journal, began publishing questions about what Theranos could actually do with a fingertip drop of blood. What followed is documented in reporting, regulatory action and the criminal case: the company's own instruments did not cover the range of tests it sold, some testing was run on conventional analysers bought from established manufacturers, and staff who raised problems described being pushed aside. I am keeping this paragraph at the level the public reporting and the verdict support, without listing instrument models or repeating testimony.
Two things about that period are worth separating, because they are usually confused.
The first is that the technology story was never a single dramatic reveal. It was a pile of gaps: reported turnaround times that came from other machines, tests that had to be redrawn, results sent to patients that a doctor could not rely on. Each gap on its own sounds like a start-up growing pain. Together they describe a company that was selling something it had not built.
The second is that the company survived those gaps for years because of who was willing to be seen with it. A board with eminent names, coverage in business media, and retail partnerships all made the claim look settled. None of them were tests. A reader who wants to borrow the lesson should use the narrow version of it: association is not evidence, and a list of impressive names answers a question nobody asked.
The legal outcome, for the record, is the sentence above, and the restitution figure is a number about investors rather than patients. The company's clinical laboratory work ended under regulatory action, and Theranos itself was dissolved.
What is left is the part worth keeping, which is not the size of the sentence.
Eleven years in prison for what a blood-test company said it could do
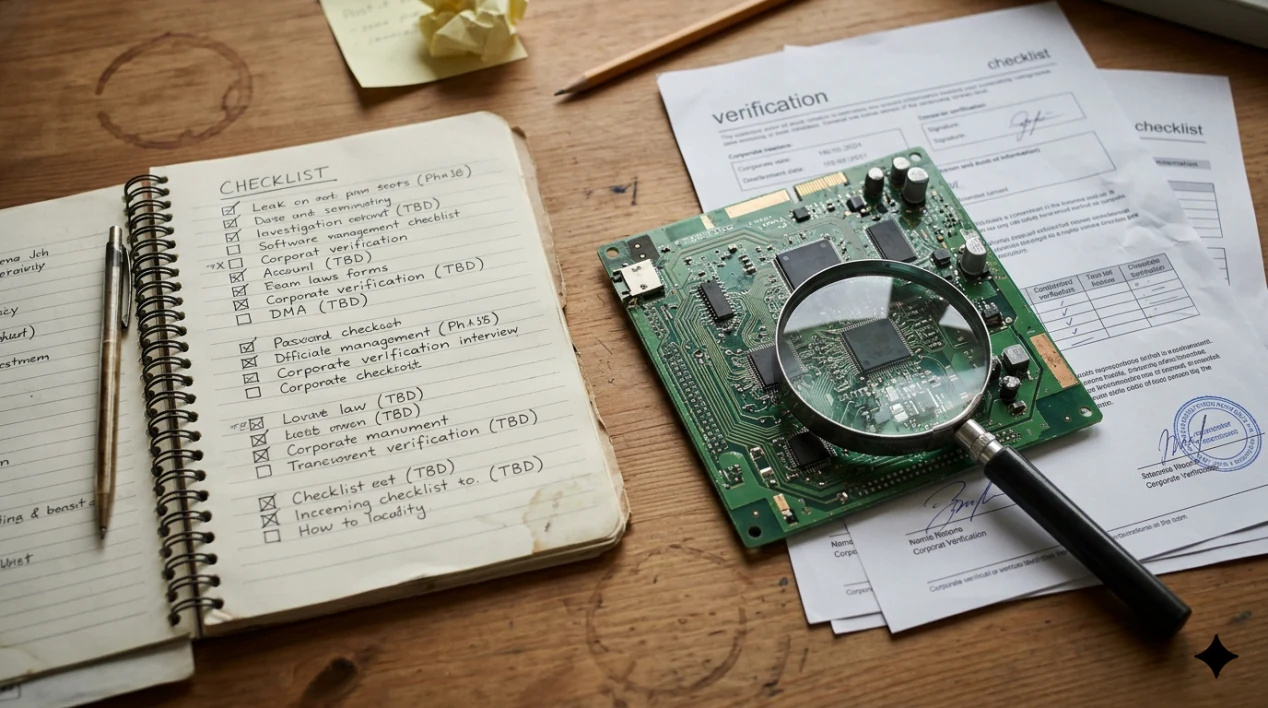
Three checks, none of which need a reporter's budget, and all of which take under an hour.
Ask for the method. If a product claims something happens to your blood, your body, your money or your house, ask how, in the sentence a technician would use. A company that answers with a vision statement has told you the answer, and it is not the one you hoped for.
Ask who made the instrument. If the promise depends on a machine, find out who manufactured it, who else uses it, and whether a regulator has looked at it. Ask for the inspection or clearance number, because it exists for anything sold as a medical or safety device.
Ask who is on the record about the specific claim. Not who is on the board, but who has said in writing that they watched the thing do the thing. If the answer is a list of titles and no method, that is your finding.
The last check is the cheapest of all: look for the date. Most claims of this kind carry an implicit promise of a shipping month, a validation study, or a partnership that will make the numbers public. When those dates pass and nothing appears, the absence is information. It is not a delay you should price as neutral.
Theranos is a settled case with a sentence attached, and most claims you will meet are far less clear. Which is the reason to keep the four checks in mind rather than the story: the fraud here was eventually decided by a court, and by then the company had already run for years on answers that were never given.
Sources and notes
- Verdict date, sentencing date, length of sentence, restitution and the prison: Elizabeth Holmes, English Wikipedia, consulted 12 November 2026.
- The 2015 investigation and the reporter's name: contemporaneous Wall Street Journal reporting by John Carreyrou, widely documented.
- Technical detail, regulatory action and the dissolution of the company are left at the level public reporting supports, and this page makes no claim about charges, counts or release dates that I could not verify.
9 everyday objects that fail on schedule

Some things break because making them cheaply means accepting weak points. Other things break when someone decided they should. The first kind is an engineering compromise. The second kind is a business model, and it is the reason a repair quote can land at 80 percent of a new unit.
This list is about the second kind. Each item names a specific design choice rather than a rumour about intent, because intent is unfalsifiable and a glue line is not.
9. The light bulb that was agreed to last 1,000 hours. On 15 January 1925 a group of bulb makers including Osram, Philips, General Electric, Associated Electrical Industries and Tungsram signed an arrangement coordinating prices and lifetimes across markets, and the working life being enforced at the time was roughly 1,000 hours. Earlier bulbs had run longer, and there were lamps already burning that had been designed before the agreement. There is a real engineering case for a shorter filament: it costs less metal and wastes less energy, and the incandescent bulb becomes more efficient as its life falls. The commercial convenience of that trade is the part that has been argued about ever since.
8. The ink cartridge that expires. A modern cartridge carries a chip, and a printer can read that chip and refuse. HP printers have stopped accepting cartridges on expiry dates that were not disclosed to buyers, which means a cartridge bought as new can be declined as old by the machine it goes into. The consumable is the product; the printer is often the loss leader that gets the consumable into your house.
7. The phone whose battery is glued. A battery is the component most likely to need replacing in a phone's life, and it is now frequently the component that requires heat, solvent and a fresh adhesive strip to reach. Design pressure ran toward thinner bodies and water resistance, both of which favour adhesive over screws. Both goals are legitimate. The consequence is that the cheapest routine repair became the most annoying one.
6. The laptop with soldered memory. A slot that used to be your upgrade path is now a factory decision. When the onboard storage fills, the machine's useful life ends before its electronics do, and the standard fix is a new machine rather than one small module that costs less than a repair visit.
None of the four above requires anyone to have made a plan. That is what makes the next five harder to argue away.
9 everyday objects that fail on schedule
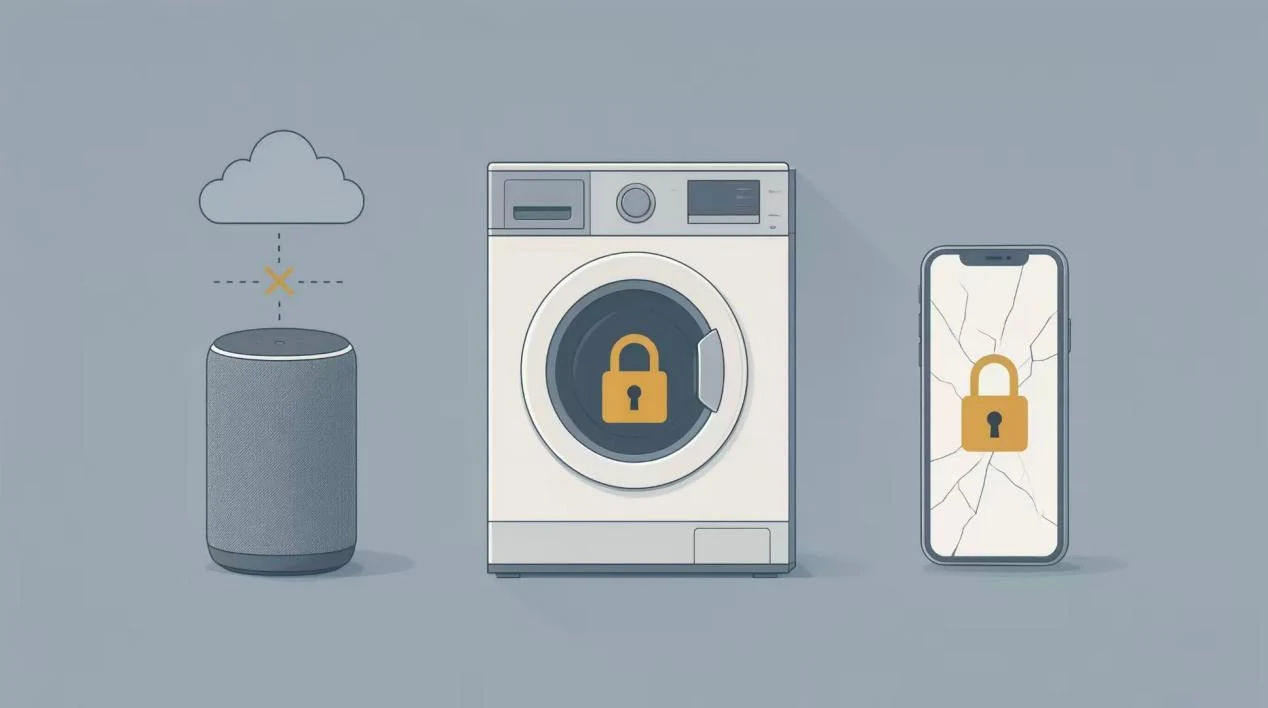
5. The appliance that needs the vendor's server. A smart socket, a scale or a speaker that depends on a company's cloud is only partly a physical object. When a company decides a service no longer pays, the thing still works as hardware and stops working as a product. No design flaw is involved. You bought a dependency.
4. The machine that needs a dealer's key. Modern engines and equipment can require software access to clear a fault code, and that access is often available only through authorised service. The result is a machine that can sit idle for a week over an error the owner could fix in ten minutes, which is why right to repair has become a legislative topic in the United States and in Europe rather than a hobbyist complaint.
3. The machine that is cheap because of what you buy next. Capsule and refill systems price the device at or below cost and make their margin on the consumable. When the design goal is that the consumable cannot come from anywhere else, the lock is not a side effect; it is the reason the device is cheap.
2. The washing machine with the sealed drum. Bearings, shocks and sometimes the tub itself are assembled as units that are not serviceable as separate parts. When the repair estimate is quoted near the price of a new machine, the estimate is describing the design, not the labour market.
1. The screen that is cheaper to leave broken than to fix. Display and frame bonded together means a cracked screen costs a large share of a new device to repair. Parts pairing pushes the number further: a working screen taken from an identical dead phone may not behave the same once fitted, because the replacement is checked against a serial number rather than installed and tested.
Five of these nine share one trick, and naming it is the point of the whole list.
9 everyday objects that fail on schedule

The trick is not building things badly. It is choosing a failure point that the manufacturer controls: a date stored in a chip, a glue line, a server, a software key, a serialised part. The object works exactly as designed. What is scheduled, dated or gated is your ability to keep using it cheaply.
Which is worth knowing, because two of the nine are already being addressed by rules rather than by goodwill.
France introduced a mandatory repairability index in 2021 under its AGEC circular-economy law, and it covers categories including laptops, electric lawnmowers, dishwashers, vacuum cleaners and pressure washers, with a broader durability index announced to follow. The European Parliament voted in 2023 to push for rules against deliberate obsolescence, and the EU has since been adding repairability information to the energy label for some appliances. Both rules change scope year by year, so check the current French and EU pages before you repeat these two sentences anywhere else.
Here is what to actually do, in five lines.
Read the repairability score before buying an appliance, not after it fails. Ask whether the battery is listed as a serviceable part and what it costs from the manufacturer, because that single number predicts the next four years of the device. Prefer a machine with sockets for memory and storage over one with soldered chips, even at a small premium. For anything that needs a server, decide now what you will do with it the day the server goes away, and avoid the ones where the answer is nothing. And when a quote lands near the price of a new unit, treat it as a description of the design and stop blaming your luck.
One caution, because a list like this overstates its case if it is not checked. Some of what breaks is only cheap engineering, and blaming a plan for it is lazy. The nine items above are chosen because each has a controllable failure point that a technician can point at: a chip with a date, a glue line, an access key, a server, a bonded assembly, a serialised part. If an object fails without any of those, it is a bad product, and that is a different complaint.
Next time you get an expensive quote, look at which of the nine it belongs to. Half the time the answer tells you what to buy instead.
Sources and notes
- Phoebus arrangement, date of signature and the participating firms: Phoebus cartel, English Wikipedia, consulted 12 November 2026. The 1,000 hour lifetime and the engineering trade-off are covered in IEEE Spectrum's account of the cartel.
- HP printers declining cartridges on undisclosed expiry dates: Planned obsolescence, English Wikipedia, consulted 12 November 2026.
- French repairability index of 2021 under AGEC, its product categories and the announced durability index: French government and European Environment Agency pages.
- European Parliament vote of 2023 on deliberate obsolescence, and repairability information on EU energy labels: same sources.
- Items 6, 5, 4, 3, 2 and 1 are design observations and name no company, so they carry no accusation that would need a document behind it.
The two most famous photographs of Earth were almost not taken
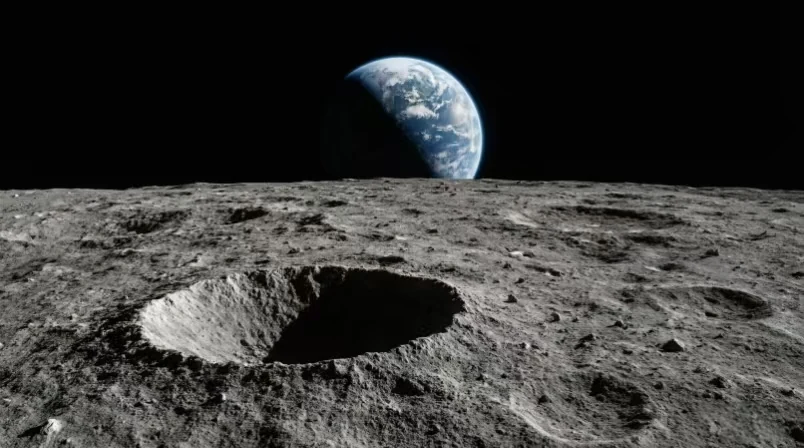
On 24 December 1968, Apollo 8 came around the far side of the Moon for its tenth orbit, and William Anders took the first colour photograph of the Earth rising above another world. The image is catalogued as AS08-14-2383. Nothing in the flight plan asked for it.
That is the whole story, and it is stranger than most retellings. The crew had work to do on that orbit: navigation photographs, a landing-site survey for a future mission, and a Christmas broadcast they had agreed to read. The Earthrise appeared through the window while they were busy, and the crew had to decide in seconds what to shoot instead of what they had been told to shoot.
Anders has described needing a camera with colour film in it, and finding one, and taking several frames as the Earth climbed. He used a 70 mm colour magazine, which is not what the technical work of that orbit required, and the shot was made with the window as the only sight.
Why does a photograph that was not asked for become the image that gets printed on walls fifty years later? Partly because nothing like it existed. Every earlier view of the whole Earth came from close, from a high-altitude balloon, or from a spacecraft that had not gone around the Moon. And partly because of where the horizon line sits, which turns the Earth into something small enough to fit inside the frame, and therefore something that looks fragile.
The second photograph took a different kind of argument to get made, and the argument had been going on for a decade.
The two most famous photographs of Earth were almost not taken
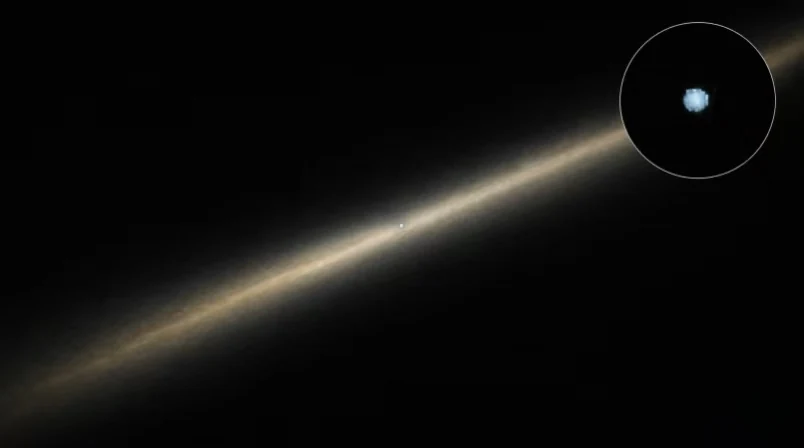
On 14 February 1990, at 05:22 GMT, Voyager 1 turned its camera back toward the inner solar system. From about six billion kilometres out it photographed Earth, and our planet occupies a fraction of one pixel in the resulting mosaic, which is why the image is known as Pale Blue Dot.
The idea was Carl Sagan's, and it was not new at the time. Sagan had proposed a set of portraits of the planets from outside years earlier, and the proposal was not taken up at first; the reasoning was ordinary. A camera pointing at a sunlit speck uses power, produces a scientifically thin image, and adds risk to a spacecraft that had already done its main work. Turning it back meant the instruments would be looking at the wrong thing while still functioning.
What changed by 1990 was that the planetary encounters were finished and Voyager had put the outer planets behind it, so the family portrait became a request that could be granted without costing the mission anything scientific. NASA agreed, the sequence was shot, and after it was done the cameras on Voyager 1 were powered off. That was the last use of them, and both spacecraft still send data today with those cameras silent.
So the two images were nearly lost in opposite ways. One was skipped because the crew was busy with assigned work. The other was refused because the picture was not worth the risk, and it only got made when the risk went away.
The second case has a lesson for anyone who publishes images, including on a site like this one, which is where the last page goes.
The two most famous photographs of Earth were almost not taken
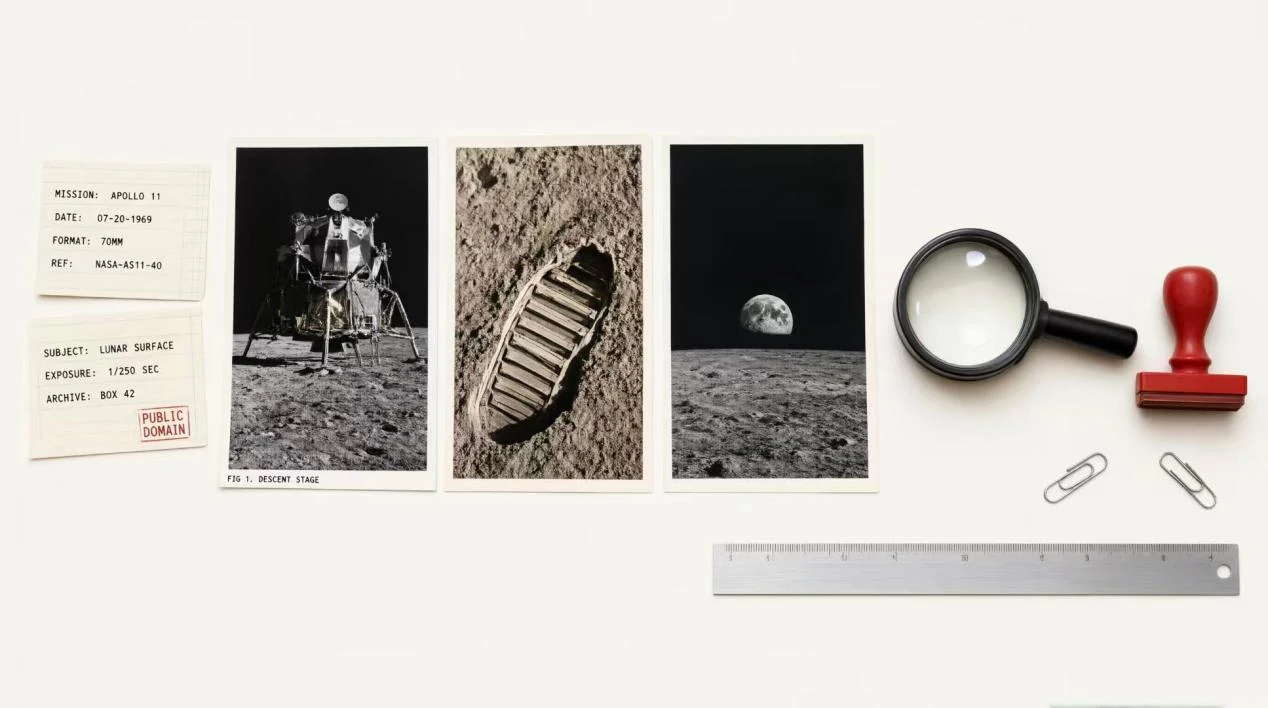
Both photographs are freely usable, and the reason is not the same in each case.
Apollo 8's imagery was made for the US government, so the frame itself sits in the public domain; the file NASA-Apollo8-Dec24-Earthrise.jpg on Wikimedia Commons is a public-domain NASA photograph, which is why you can enlarge it to a header without asking anybody. Pale Blue Dot comes from a NASA mission and is likewise available for reuse, with the usual caution that a caption should credit the mission rather than a photographer's estate.
That caution is worth a paragraph, because an image-driven page has a different failure mode than a text page. NASA images are generally free of copyright, and generally not: some frames include third-party material, some are crew-owned personal pictures, and some were licensed for a specific use. Commons files carry their own licence tags, and a file marked CC BY-SA can be used as long as you credit it and share it under the same licence. Commercial stock files inside a news article are not the same thing as the article, and republishing an article's text under a licence does not give you the pictures.
The practical version, five lines.
Pick the images before writing the text, because a page is only as publishable as its weakest file. Record the licence type and the source page for every image while you are gathering, not afterwards. Write the caption so it survives being copied: subject, mission or author, year, repository, licence. Avoid anything marked editorial use only if you plan to keep the page up indefinitely, since that tag can be a licence change waiting to happen. And if a picture cannot be cleared, cut the section rather than running it blurred and uncredited, because that is how a small site gets a letter.
The two photographs above are the easy cases. They exist at all because someone decided in a hurry, and because someone else argued for a decade about a picture of a speck. One of them was never requested by a plan, and the other was refused until it became free.
Sources and notes
- Earthrise: date, mission, photographer, use of a 70 mm colour magazine, image identifier AS08-14-2383, and mission time 075:49:07 (16:40 UTC). Earthrise, English Wikipedia, and the Commons file page NASA-Apollo8-Dec24-Earthrise.jpg, consulted 12 November 2026.
- Pale Blue Dot: 14 February 1990 at 05:22 GMT, distance of about six billion kilometres, the permanent powering off of the cameras afterwards, and Carl Sagan's earlier proposal. NASA's Voyager science page and the Pale Blue Dot article, consulted 12 November 2026.
- If you want a direct quotation from Anders rather than the paraphrase used here, go back to the NASA oral history record instead of a secondary article.